.svg "bes-logo (1)")
Power diodes are not easy parts to measure. Circuit design requires high-quality models, and these require high-quality ...
Power diodes are not easy parts to measure. Circuit design requires high-quality models, and these require high-quality data — at high power. Typically, this requires a large investment in very specialized equipment. To bring up a testing and characterization program for high-power LEDs, Boulder Engineering Studio built a series of tools to put much more common instruments to work collecting this data.
Problem: self heating
When a part is meant to be operated at 30-40A and several volts, self-heating during measurement is critically important. With over a hundred watts being dumped into a small space, it doesn't take long at all for the junction temperature to rise enough to throw off the measurements. Just look at this simulation of the temperature of a power semiconductor over a few milliseconds:
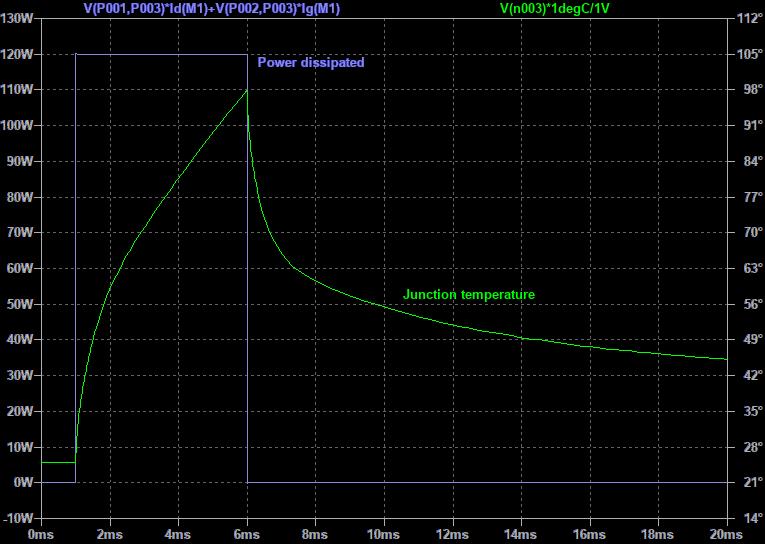
To keep these effects limited to a point where accurate data can be collected, we need to slam large amounts of power into a diode and then immediately remove it, with a clean enough pulse to avoid secondary effects like (potentially nonlinear) reactances and non-flat equipment transient response from introducing error. Our goal here was to slew from zero to at least 45A in no more than half a microsecond, giving another half microsecond or so for the system to settle, and then 2-4 more microseconds of hold time in which a measurement can be taken. These large numbers (90MA/s!) necessitate very careful design of the stimulus generator.
Problem: high temperature measurements
The reason thermal effects have to be well controlled is that the behavior of these devices is dependent on temperature. A good model accounts for temperature and can predict their behavior anywhere in the anticipated operating range. A corollary of minimizing device self-heating is the need to control device temperature. We decided on a maximum test temperature of 85°C, which is high enough to characterize the devices without being so high as to make measurement circuit design impractical. Because the signals move so fast, the connections between equipment and device under test must be extremely short. This means that a portion of the measurement apparatus itself must be heated to the same temperature as the device. A key aspect of our design is to separate control and sampling from the actual measurements. The test apparatus that is placed in the oven has the primary task of faithfully converting between the high-power signals –whose loop size must be tightly controlled, and a transmission line-compatible signaling regime that allows the data to be sent outside the oven for control and measurement by separate instruments.
Solution
General architecture
Our instrumentation consists of a pair of fixture boards, one for high-current measurements and the other for low-current measurements. This allows each to focus on its strengths. Otherwise, making the low-current measurements needed to fully characterize the semiconductor behavior in the transition region between off and on would require the high-current circuitry to also have negligible impact on nanoamp-level measurements. Splitting these lets each system be specialized.
Overall system layout
First, we needed a coherent design that would allow easily swapping devices, support fine temperature control, allow measurements from nanoamps to 45A, provide low-inductance power connections and high speed-capable Kelvin connections to devices, all in support of accurate measurements. We created a system that would allow devices with arbitrary footprints to be installed using a per-footprint interposer that can be created in only a few minutes. These interposer boards mount to the test fixtures on four press-fit M6 screw posts, each capable of carrying over 100A. The spacing of the posts allows the driver circuit to be integrated easily between them to keep inductance minimal. Then, a six-pin header brings a differential pair for voltage sense between the boards, as well as a shield connection and an interlock to shut the system down if the board is not installed. A temperature probe is fixed directly to the DUT in a method determined per device footprint style.
High current measurements
Pulses 45A tall and only 5µs wide can't reasonably be sent down cabling into an oven. To provide these pulses, we designed a test instrument board, named Mighty. Mighty takes in a large, DC stimulus current from an external programmable power supply. It ballasts the current using a bank of inductors and locally generates a control pulse with software programmable pulse width between 2µs and 7µs. Energy comes from the inductors’ stored magnetic field, not from the power supply itself. This pulse drives a pair of steering MOSFETs to divert the ballasted current briefly into the device under test. Then, Mighty's output system selects between the resulting voltage signal and a couple onboard calibration references to emit through a coaxial cable to an oscilloscope. The current measurement is derived separately from DUT voltage with a wideband current sense transformer, allowing both measurements to be made with no need for common-mode rejection (which would become exceedingly difficult at these slew rates).
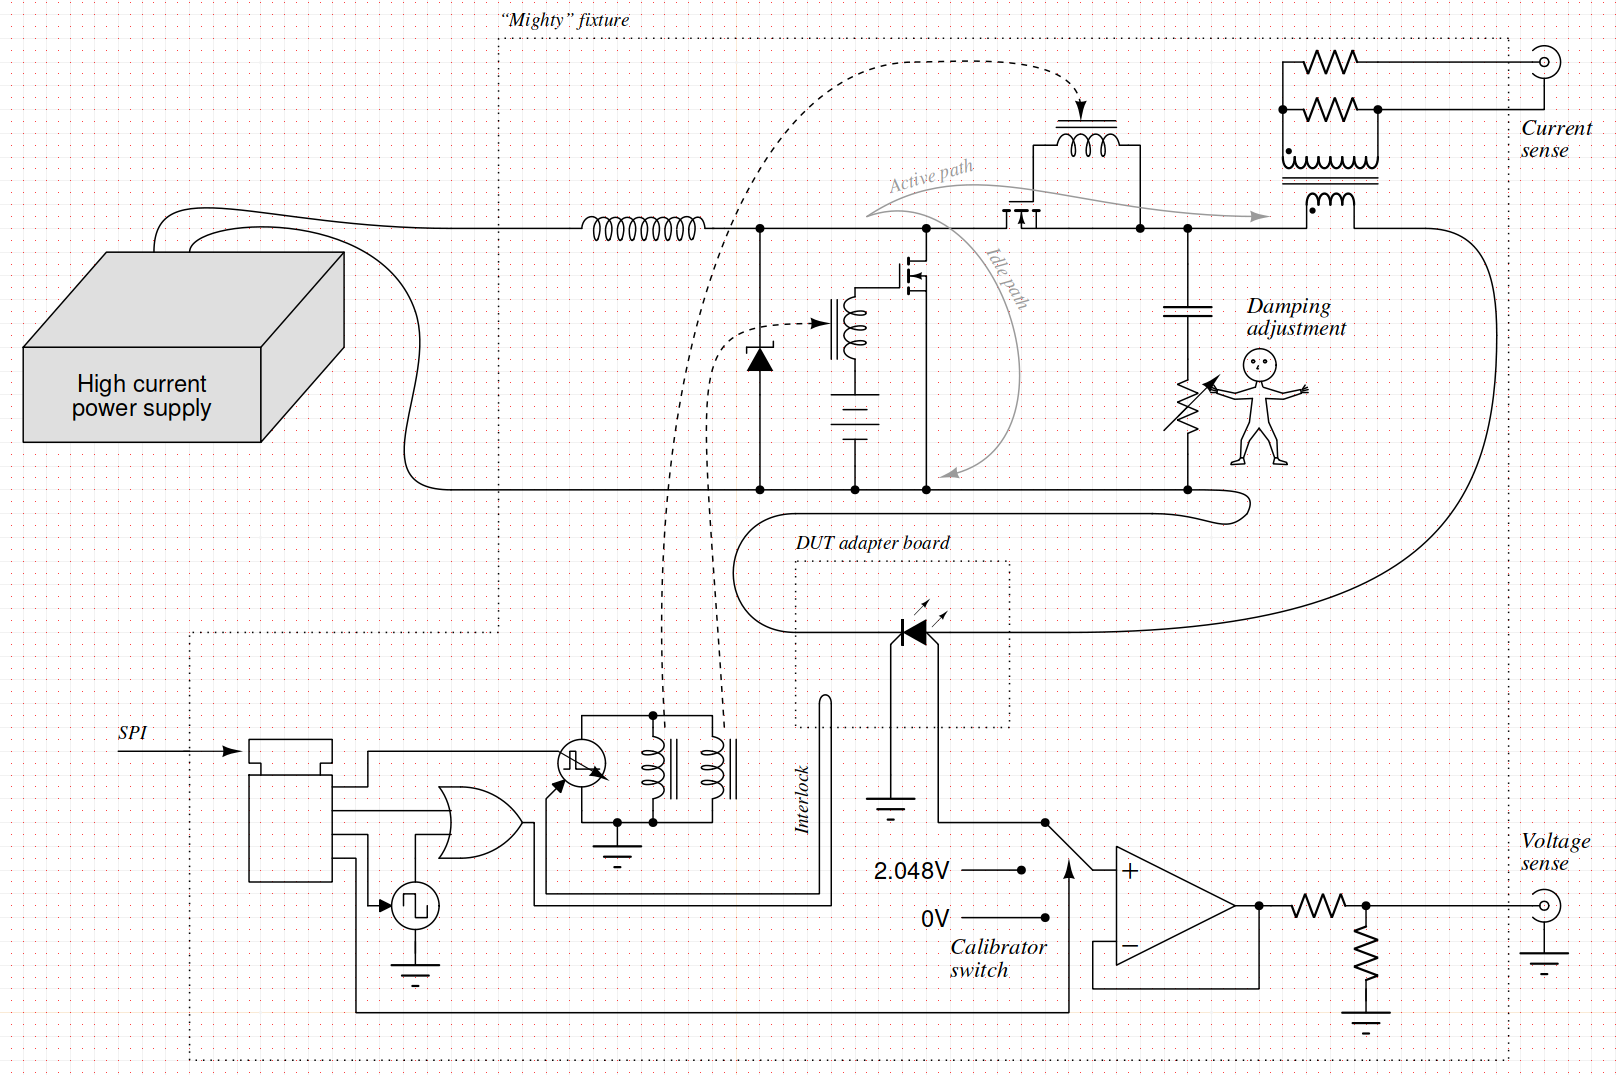 Figure: a sketch of Mighty's circuitry.
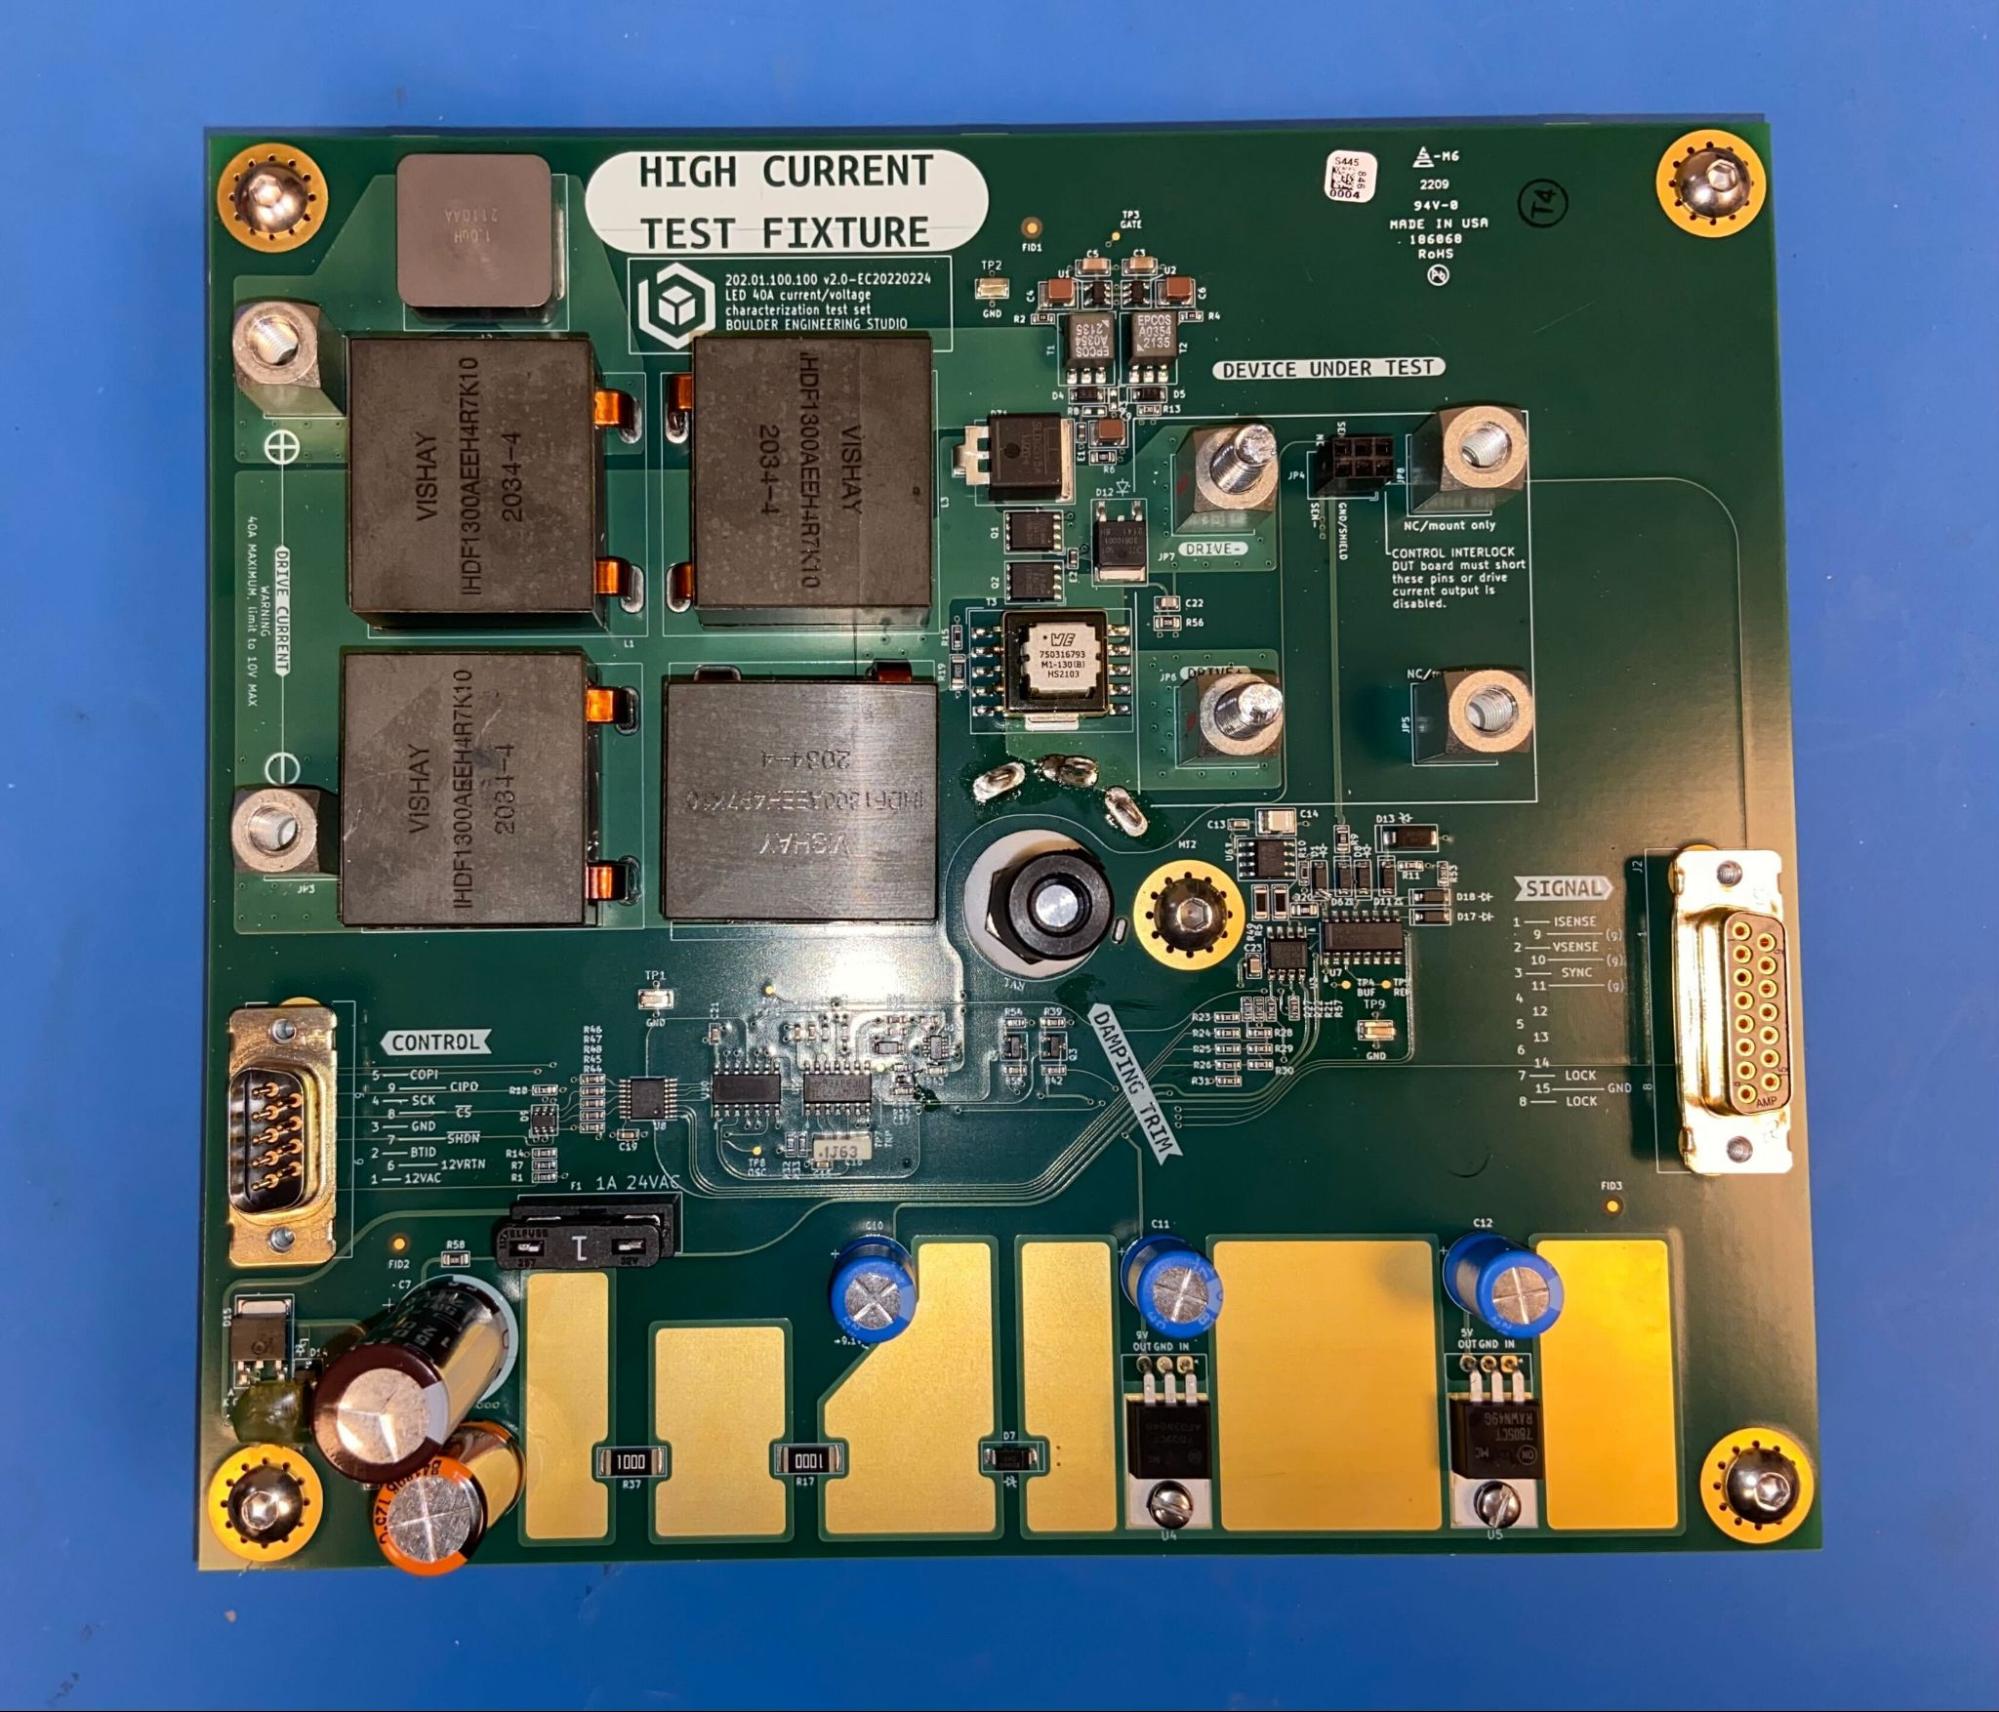
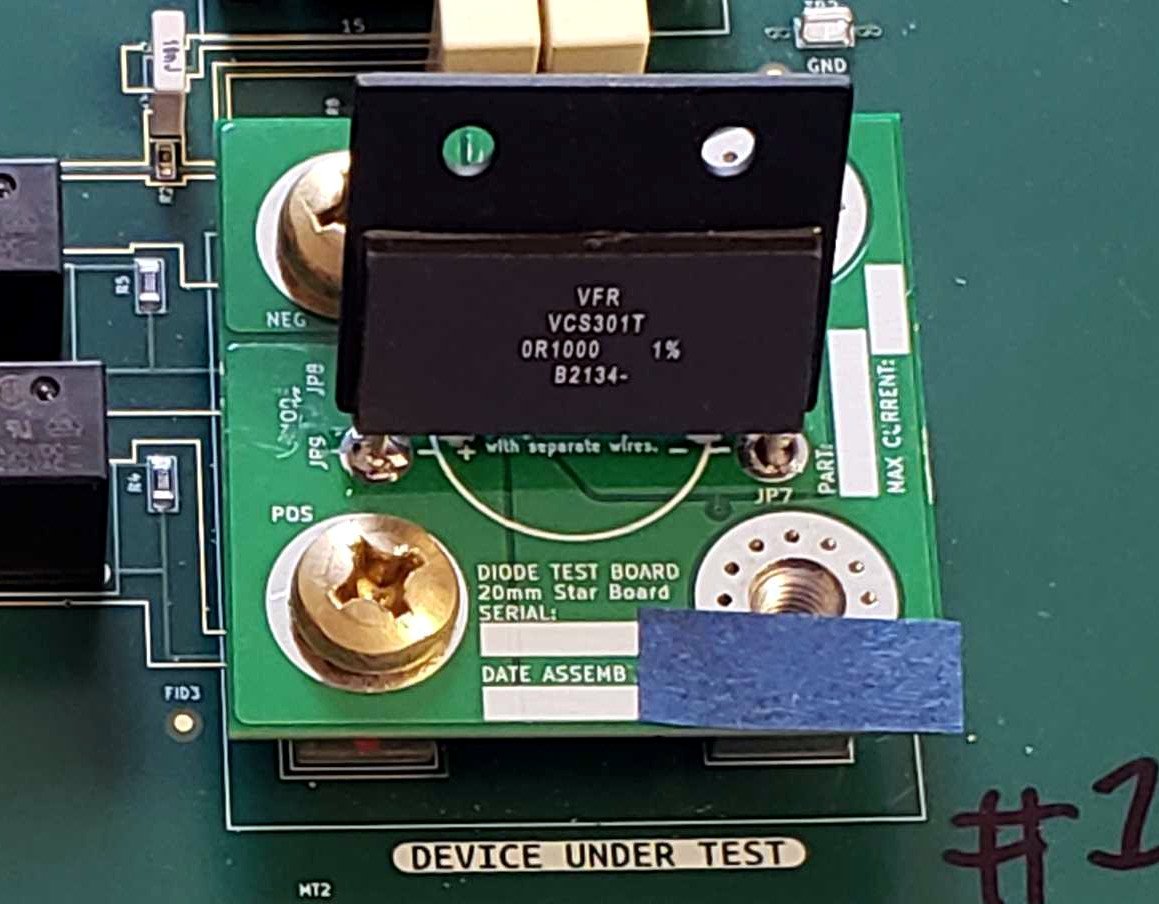
Figure: an assembled Mighty board, with empty DUT socket.
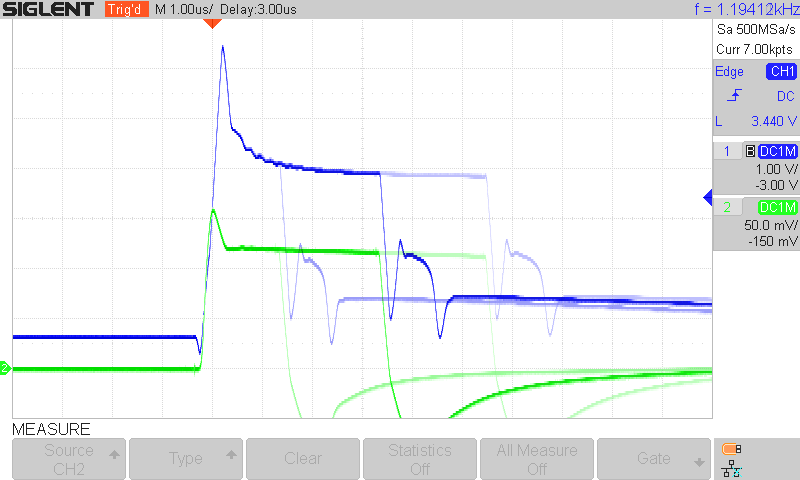
Figure: Mighty demonstrating programmable pulse widths while driving 6A (green trace) into a bridge rectifier at pulse widths of 2µs, 4µs, and 6µs.
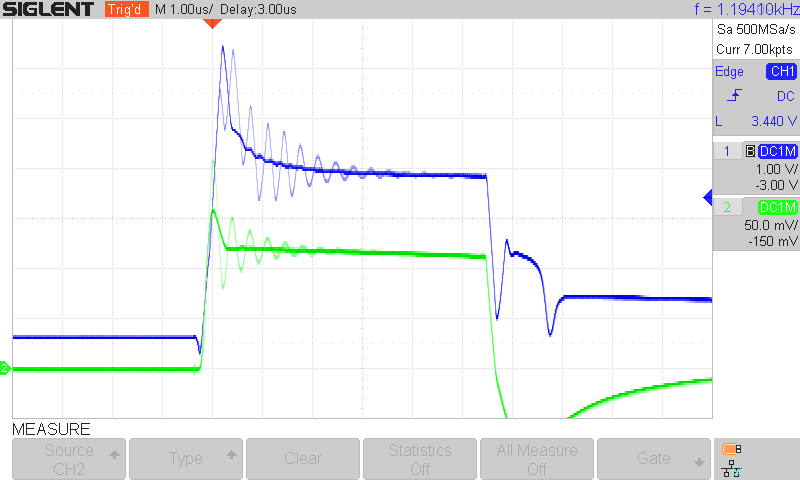
Figure: The importance of damping. Every device under test has different reactive properties, so a user-adjustable damper is provided to clean up the waveforms.
Low current measurements
Low-current measurements for a power LED include lower-current (up to about 2A) I/V curve, reverse and forward leakages, and DUT capacitance over a range of reverse bias voltage. These requirements present a new set of challenges. Measurements need to be made at high impedances in order to capture the low injection region, and again this must be done over a wide range of temperatures, so the instrumentation needs to be protected from the oven. Our second fixture, named Tiny, has resistive bias tees for stimulus injection and high precision buffers to transmit the resulting voltages out the system cabling, all with careful attention to bias currents and leakages. A bundle of coaxial cables brings these signals in and out of the system. The bias tees allow voltage to be injected onto the device under test and isolated from the capacitance meter, and to have relays to bypass them for measurements above about a microamp. A B&K Precision LCR meter provides the capacitance measurements, and a Keithley SourceMeter provides both bias sources and current measurement.
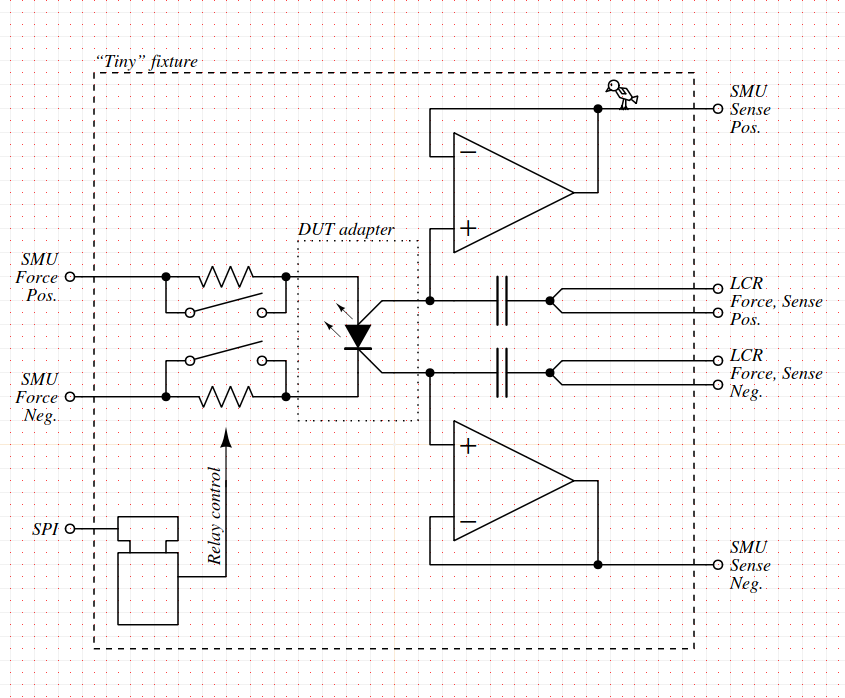
Figure: a sketch of the circuitry on Tiny.
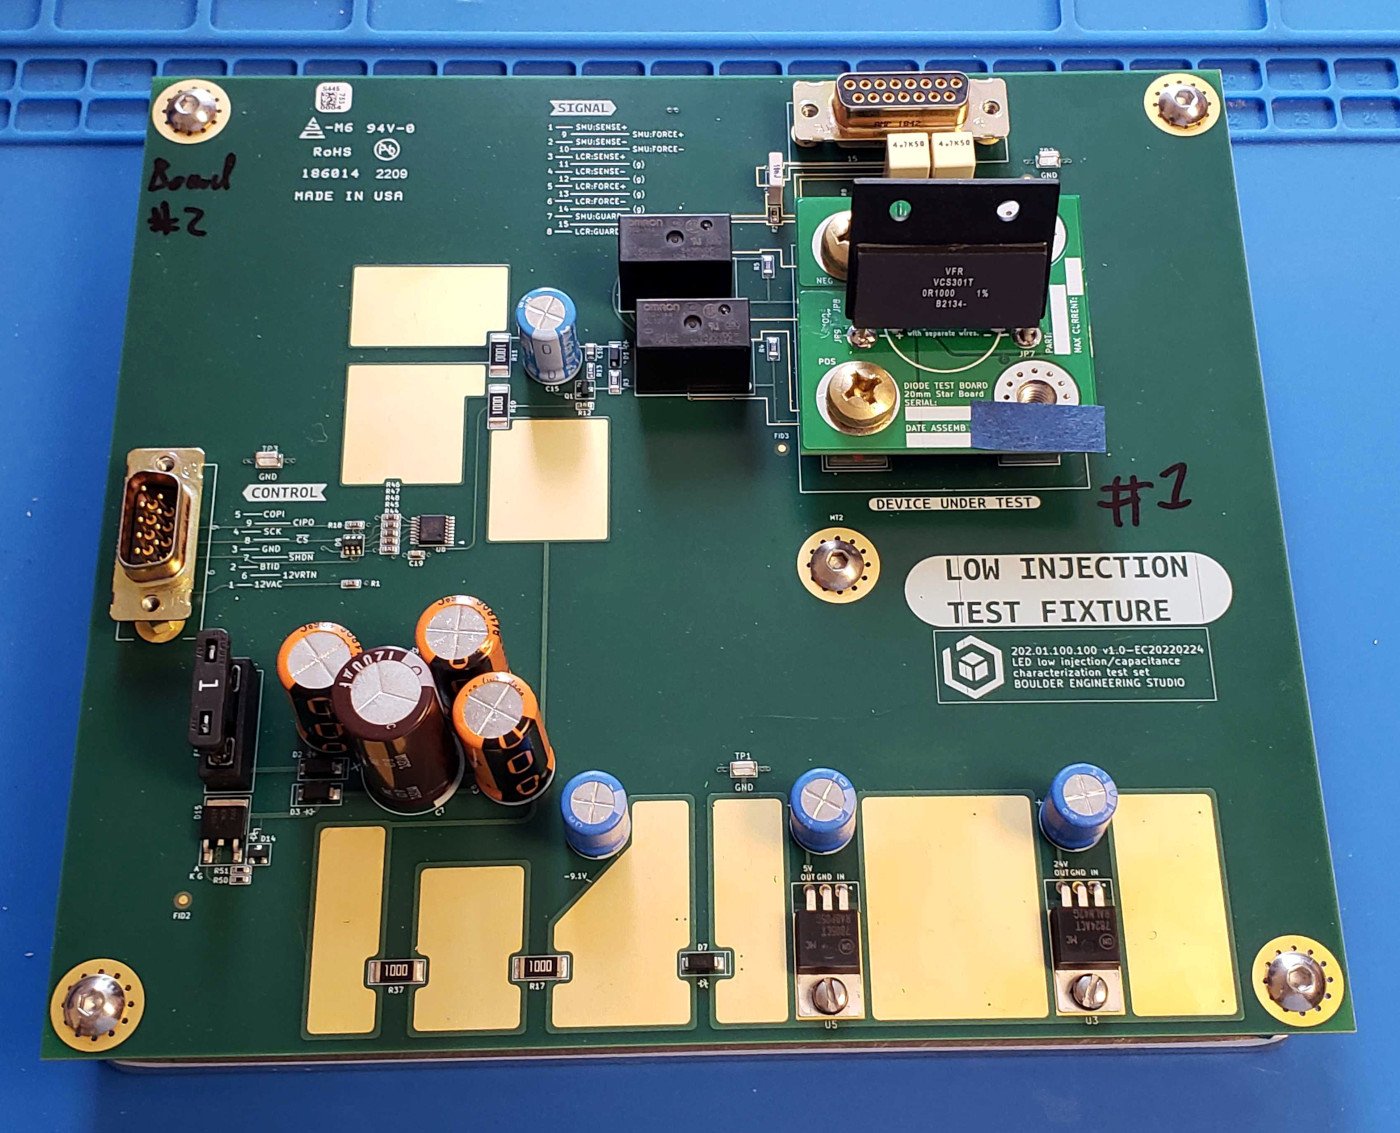
Figure: an assembled Tiny board. A calibration board is installed in the socket, with an ultra low-tempco resistor on it.
More challenges
Safety
These are powerful LEDs! Some of them can emit intense invisible light. This means the operator should never be exposed to the LEDs' emissions in any way during operation. To ensure this, we implemented several safety features, particularly on Mighty. The control signal for the pulse generator passes through two interlocks in series, one on the DUT board itself to ensure this is properly inserted, and one being a microswitch on the door of the test enclosure configured to close when the door shuts. The control circuitry is designed to cut out the signals in several redundant places when commanded "off" by the controlling system. In the event that the main driver MOSFET fails short, the design of the drive bridge where the second MOSFET is always "on" when not operating shunts the majority of the drive current away from the LED. In the remote chance that the drive MOSFET fails short and the shunt MOSFET fails open, the automation software can detect excess power dissipation in the form of a rise in the short circuit voltage reported by the power supply, and shut down completely. Lastly, the one part of required human involvement in the test (adjusting the variable damping circuit) is made remote by attaching a flex shaft to the damping rheostat that runs to the exterior of the enclosure.
Pulse generation
Drive pulses are narrow and sparse: microsecond widths with repetition rates ranging from a kilohertz down to single-shot operation. Since many commercial signal generators have minimum pulse width limitations that scale with repetition rate, we decided to put a pulse generator circuit locally on Mighty. This circuit consists of a TLC556 fast dual timer, an op amp, and a couple 7400-series logic parts. (Didn't expect to read that sentence in 2022, did you!?) An R-2R DAC off a shift register allows the computer to set the control voltage of half the 556 operating in monostable mode to generate the pulse itself, and other bits from the shift register control the other half as a free-running oscillator and provide some other control signals.
As a bonus, all this circuitry is very generic. There may well be parts that can do this out of the box, but many of them, such as Analog Devices’ venerable TimerBlox series, have been very hard to purchase during the Great Pandemic Part Shortage of 2020 2021 2022. If we need to remanufacture fixture boards in the future to replace damaged units or scale up testing, equivalent parts will be easy to find.
Deriving models
Of course, it wouldn't be fair to suggest this was a purely electrical undertaking. Oscilloscopes and sourcemeters and bulky power supplies do not emit SPICE models without adequate persuasion in the form of a software package. Our software engineering team built a system with three pieces to coordinate all of this:
- A tracking system to index DUTs and cross reference them with test parameters and data.
- A test equipment automation program to drive the rack full of equipment to make the measurements.
- A model fitting package to convert raw data into simulation models and plots.
In order to characterize the device at high current, the test software sets up the power supply and oscilloscope to take measurements. Then, it tells Mighty to emit its calibration signals; these are used for gain and offset calibration of the voltage channel. To calibrate the current channel, a series of measurements can then be taken using a Vishay Precision reference resistor with low inductance and temperature coefficient. After a human operator adjusts a damping circuit to remove parasitic resonances from the system, the computer steps Mighty and the device under test through a series of drive currents, typically ranging from around 2A up to the device's maximum pulsed current rating. Each waveform is bounded and cropped to locate just the usable test data, then added to a collection of points.
After this, the device is characterized at low current. It is moved into Tiny, and the computer continues its test sequence. The current is now stepped down from 2A into the microamp or nanoamp range, and these points are also added to the collection. Separately, the bias tees are switched in, and capacitance over voltage is measured over the rated reverse range of the DUT.
These tests are repeated at multiple test temperatures. This data then moves to the model fitting package, which computes SPICE model parameters. A least-squares curve fit is wrapped around a single-diode SPICE simulation to allow fitting parameters in the way that produces the closest representation of the device behavior.
At the end of this testing, a complete SPICE model and a series of plots are generated. These go to engineering for review and are then ready to bundle and release.
Summary
In summary, Boulder Engineering Studio built a system to test, characterize, and model high-power LEDs with a combination of off-the-shelf and custom test equipment. The system can measure everything from nanoamps to fast, narrow pulses at tens of amps. Careful thermal design takes into account self-heating from the device and allows high-temperature measurements. This allows us to generate accurate models that can predict the LED’s behavior anywhere in the anticipated operating temperature range. Finally, custom software was developed to track the DUTs, run the test system, and generate SPICE models from the collected data. Using a closed loop directly around the SPICE model itself, we are able to use this data to closely fit a model to the device's real-world behavior.